

数据可视化 (1) - 折线图
1 需求:画出某城市 11 点到 12 点 1 小时内每分钟的温度变化折线图,温度范围在 15 度 ~18 度
import random

import matplotlib.pyplot as plt

# 设置折线图的大小、清晰度
plt.figure(figsize=(12, 6), dpi=80)
# x轴时刻(11~12点)
x = range(60)
# y轴温度(15~18度)
y = [random.uniform(15, 18) for i in range(60)]
# 画折线图
plt.plot(x, y, label="北京")

# 构造中文列表的字符串
# x轴(11点**分)
x_ticks = ["11点{}分".format(i) for i in x]
# y轴(0~40)
y_ticks = range(40)
# 修改x,y坐标的刻度
plt.xticks(x[::5], x_ticks[::5])
plt.yticks(y_ticks[::5])

# 增加标题、x轴、y轴描述信息
plt.title("北京市11点到12点1小时内每分钟的温度变化折线图")
plt.xlabel("时间")
plt.ylabel("气温")
# 添加图形注释
plt.legend(loc=0)

# 保存图像
plt.savefig("./weather.png")

# 显示图像
plt.show()
效果展示: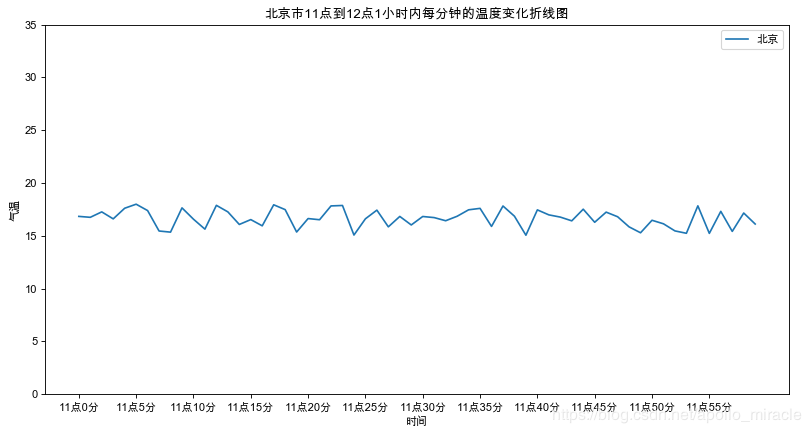
2 需求:再添加一个城市的温度变化
import random

import matplotlib.pyplot as plt

# 设置折线图的大小、清晰度
plt.figure(figsize=(12, 6), dpi=80)
# x轴时刻(11~12点)
x = range(60)
# y轴温度(15~18度)
# 北京
y_bj = [random.uniform(15, 18) for i in range(60)]
# 上海
y_sh = [random.uniform(5, 9) for i in range(60)]
# 画折线图
plt.plot(x, y_bj, label="北京")
plt.plot(x, y_sh, color="r", linestyle="--", label="上海")

# 构造中文列表的字符串
# x轴(11点**分)
x_ticks = ["11点{}分".format(i) for i in x]
# y轴(0~40)
y_ticks = range(40)
# 修改x,y坐标的刻度
plt.xticks(x[::5], x_ticks[::5])
plt.yticks(y_ticks[::5])

# 增加标题、x轴、y轴描述信息
plt.title("某些城市11点到12点1小时内每分钟的温度变化折线图")
plt.xlabel("时间")
plt.ylabel("气温")
# 添加图形注释
plt.legend(loc=0)

# 保存图像
plt.savefig("./weather.png")

# 显示图像
plt.show()
效果展示: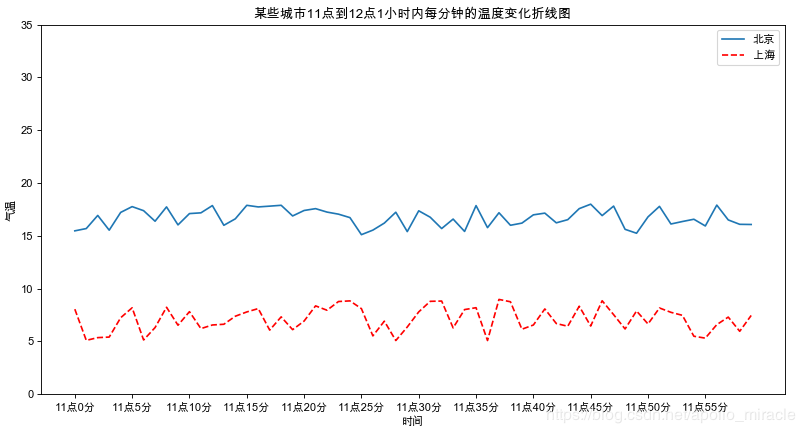
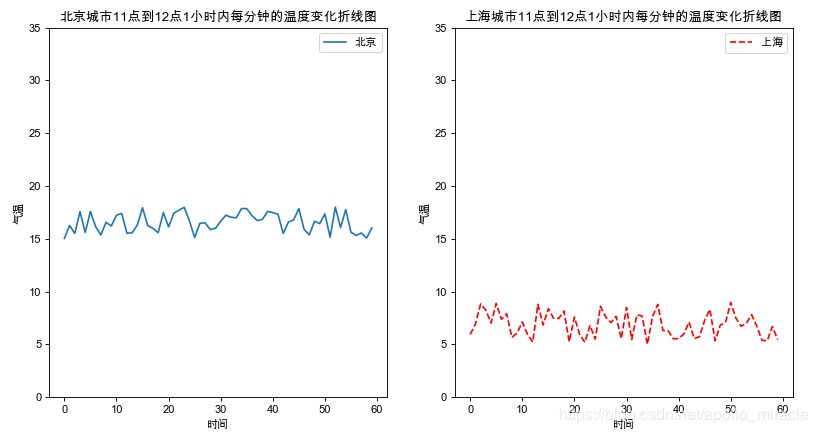
3 需求:多个坐标系显示
import random

import matplotlib.pyplot as plt

# 设置折线图的大小、清晰度
# plt.figure(figsize=(12, 6), dpi=80)
fig, axes = plt.subplots(nrows=1, ncols=2, figsize=(12, 6), dpi=80)

# x轴时刻(11~12点)
x = range(60)
# y轴温度(15~18度)
# 北京
y_bj = [random.uniform(15, 18) for i in range(60)]
# 上海
y_sh = [random.uniform(5, 9) for i in range(60)]
# 画折线图
axes[0].plot(x, y_bj, label="北京")
axes[1].plot(x, y_sh, color="r", linestyle="--", label="上海")

# 构造中文列表的字符串
# x轴(11点**分)
x_ticks = ["11点{}分".format(i) for i in x]
# y轴(0~40)
y_ticks = range(40)
# 修改x,y坐标的刻度
# plt.xticks(x[::10], x_ticks[::10])
# plt.yticks(y_ticks[::5])
axes[0].set_xticks(x[::10], x_ticks[::10])
axes[0].set_yticks(y_ticks[::5])
axes[1].set_xticks(x[::10], x_ticks[::10])
axes[1].set_yticks(y_ticks[::5])

# 增加标题、x轴、y轴描述信息
# plt.title("某些城市11点到12点1小时内每分钟的温度变化折线图")
# plt.xlabel("时间")
# plt.ylabel("气温")
axes[0].set_title("北京城市11点到12点1小时内每分钟的温度变化折线图")
axes[0].set_xlabel("时间")
axes[0].set_ylabel("气温")

axes[1].set_title("上海城市11点到12点1小时内每分钟的温度变化折线图")
axes[1].set_xlabel("时间")
axes[1].set_ylabel("气温")
# 添加图形注释
# plt.legend(loc=0)
axes[0].legend(loc=0)
axes[1].legend(loc=0)

# 保存图像
plt.savefig("./weather.png")

# 显示图像
plt.show()
效果展示: