
服务端数据丢失问题排查
问题现状:服务端日志丢失严重,日均百万的数据量降至十万,简单排查网络端口、客户端采集日志均无异常,服务端服务正常。
现场环境:UEBA6.0 中移在线定制版
架构概要:服务端为 ELK 架构(ElasticSearch、Logstash、Kibana),客户端采集数据通过 udp 协议发往服务端 logstash 中,并进行处理过滤后存入 es 索引中,kibana 通过调用 es 索引中的数据进行展示。
一、综合排查:
a, 查看文件句柄数:
ulimit –a
b, 修改服务端策略:
路径:录像 - 录像策略 - 高级策略设置。
是否发送http返回信息

ResponseEnable=1   #此处将1改为0(0表示关闭)
c, 查看 logstash 句柄数:
ps -ef | grep logstash   #查看logstash的pid
lsof | grep 获取的pid | wc -l   #查看logstash的句柄数正不正常
d, 查看 elasticsearch 句柄数:
ps -ef | grep elasticsearch   #获取pid
lsof | grep 获取的pid | wc –l  #查看es的句柄数正不正常
二、初步定为 logstash 处理性能问题:
a, 更新策略文件 uebaoption.ini:
[Common]
IsOutUdpLog=1
IsOutPluginLog=1
b, 更新客户端文件 (plugin\Com.Isearch.Monitor.Iexplore):
UEBAMonitorIexplore.dll
UEBAMonitorIexploreX64.dll
c, 更新客户端文件(bin\)
UEBAMon.exe
UEBAMon64.exe
UEBARecorder.exe
目的:服务端关闭采集 clip、npro、ib、web 四种日志,减轻 logstash 处理负担
验证:UDP 抓包 10000+,服务端 100+
d, 服务端 /isearch/isa/logstash/logstash.conf 中清楚 filter 中所有内容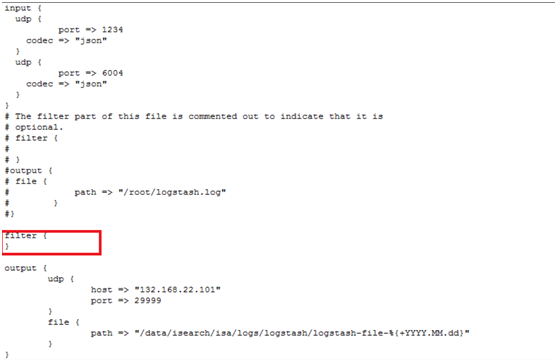
目的:Logstash 的 filter 放开,至使服务端发送至 logstash 的数据完全不作处理直接写入 es 中
验证:UDP 抓包 10000+,服务端 100+
结论:排查logstash处理性能无异常,暂时定位es问题
三.es 排查定位
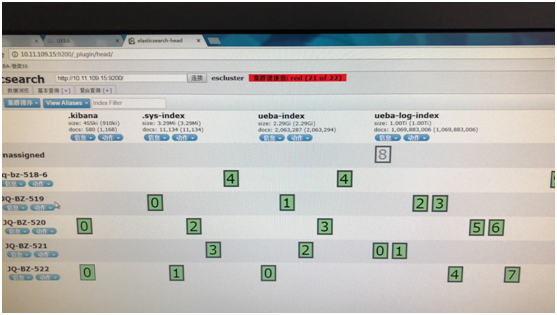
a, 服务端页面 es 集群状态查询:
10.11.109.15:9200/_plugin/head
集群状态红色,有块 shard 节点灰色
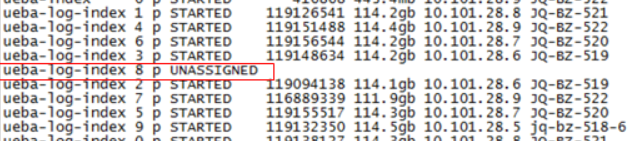
b, 查看集群分片信息
curl -XGET http://localhost:9200/_cat/shards
查看目前有哪些 es 节点分片有问题,UNASSIGNED 表示未分配
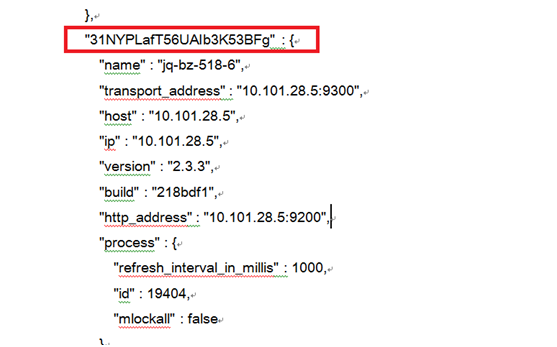
curl 'localhost:9200/_nodes/process?pretty'
查看节点为 master 的节点唯一标识
c, 逐个修复每一个节点分片数据, 根据上步输出结果修改 index, shard ,node
curl -XPOST 'localhost:9200/_cluster/reroute' -d '{
"commands" : [ {
"allocate" : {
"index" : "ueba-log-index",     #对应索引名
"shard" : 8,                            #对应损坏的shard
"node" : "31NYPLafT56UAIb3K53BFg",  #对应唯一标识
"allow_primary" : true
}}]}'
输出:返回 STARTED 表示已分配成功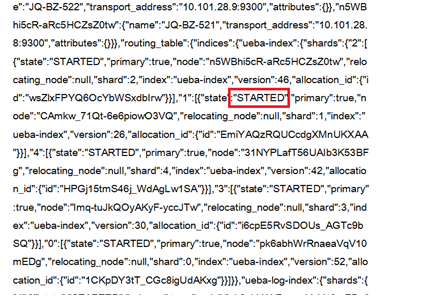
d, 重启 es,启动成功,
./elasticsearch.sh stop
./elasticsearch.sh start
如未成功,检查 es 报错日志,通过报错日志可知,插件 license 过期了,但不影响。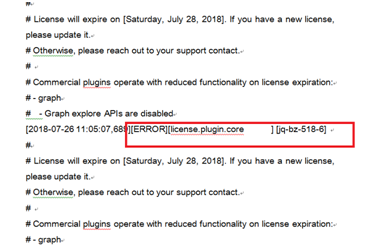
移除 ueba-log-index 目录:
/isadata/esdata/data1/data/escluster/nodes/0/indices/ueba-log-index /
验证:
es 服务启动正常
集群状态页面正常
服务端日志数据恢复结论:某块shard损坏导致数据写入es异常,至使后台数据丢失
五. 命令与工具
tcpdump -ieth1 udp port 6004 and host 192.168.0.144 -s 0 -w  test.cap #抓取指定IP的udp包并写入某个文件

tcpdump -ieth1 udp port 6004 -s 0 -w  test.cap #抓取全量IP的udp包并写入某个文件
使用 Network Monitor 工具打开写入的文件,用 udp 抓包数与 logstash-file-2018.XX.XX 进行对比,时间、ip 等因素自行计算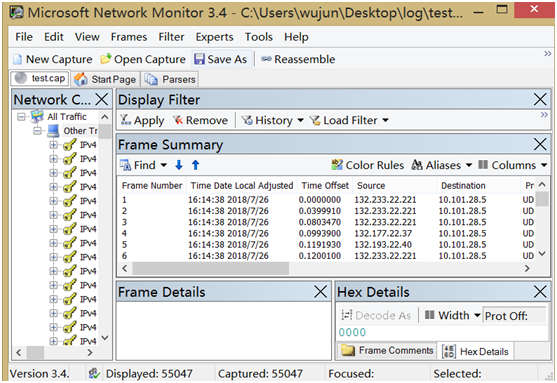
curl 命令详见https://blog.csdn.net/lixi5718/article/details/76270700
