#!/usr/bin/env Python3
# -*- coding: utf-8 -*-
# @Software: PyCharm
# @virtualenv:workon
# @contact: 1040691703@qq.com
# @Desc:Code descripton
__author__ = '未昔/AngelFate'
__date__ = '2020/4/25 16:51'
import numpy as np
import matplotlib.pyplot as plt
def Test(t):
return np.exp(-t) * np.cos(2 * np.pi * t)
t1 = np.arange(0.0, 10.0, 0.1)
t2 = np.arange(0.0, 10.0, 0.02)
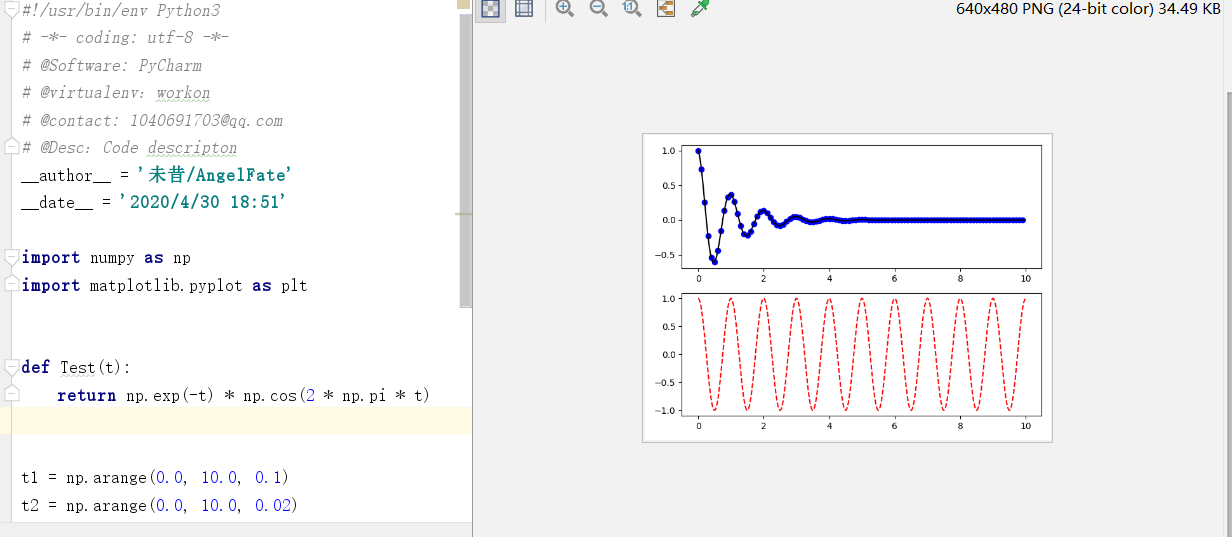
plt.figure("2subplot")
plt.subplot(211)
plt.plot(t1, Test(t1), 'bo', t2, Test(t2), 'k')
plt.subplot(212)
plt.plot(t2, np.cos(2 * np.pi * t2), 'r--')
plt.show()