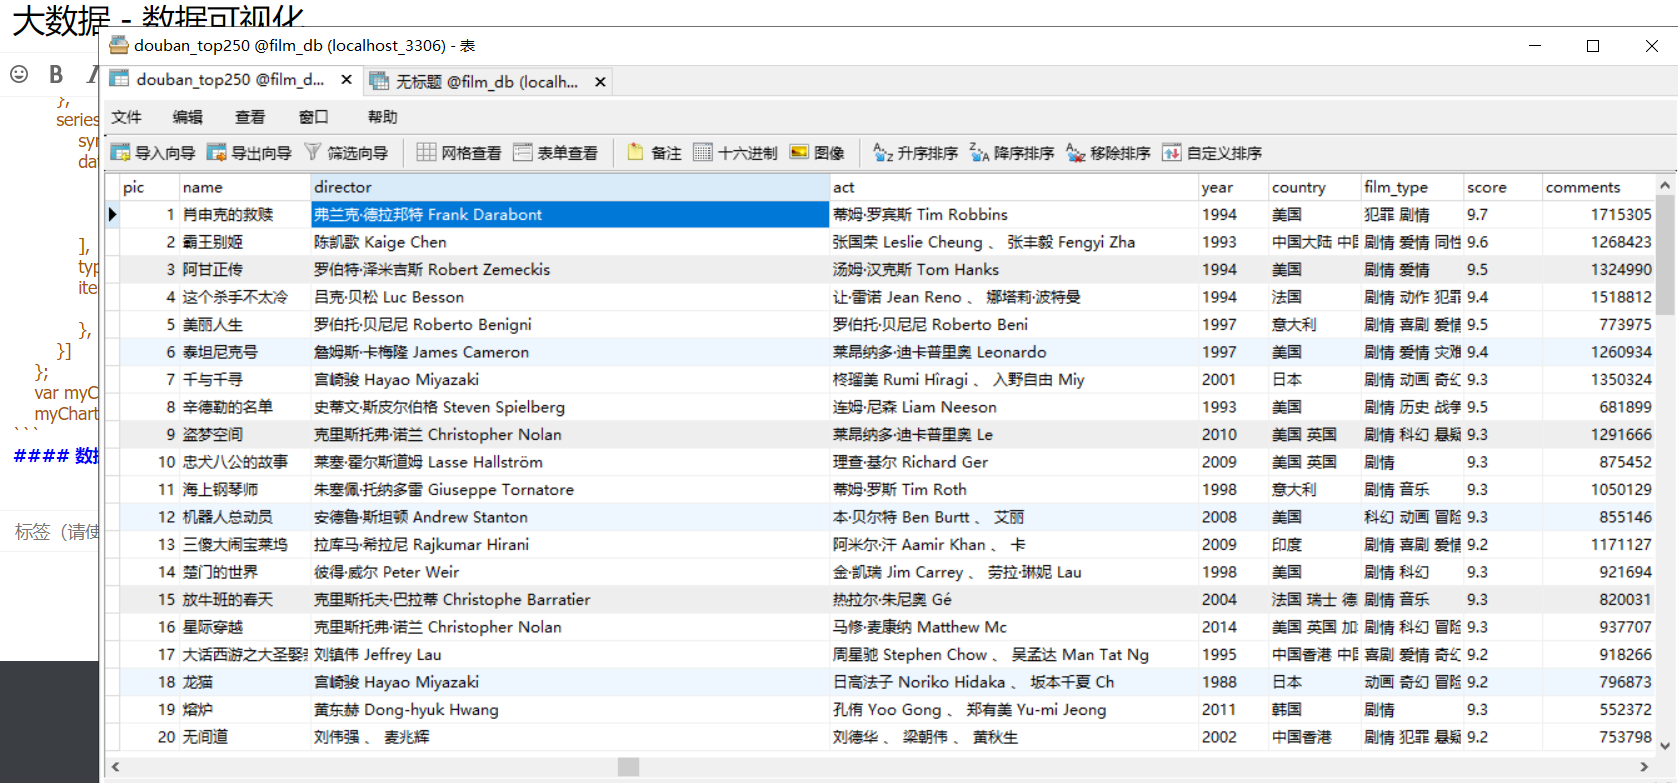
大数据处理的数据我们需要将其进行,图形化展示
效果图
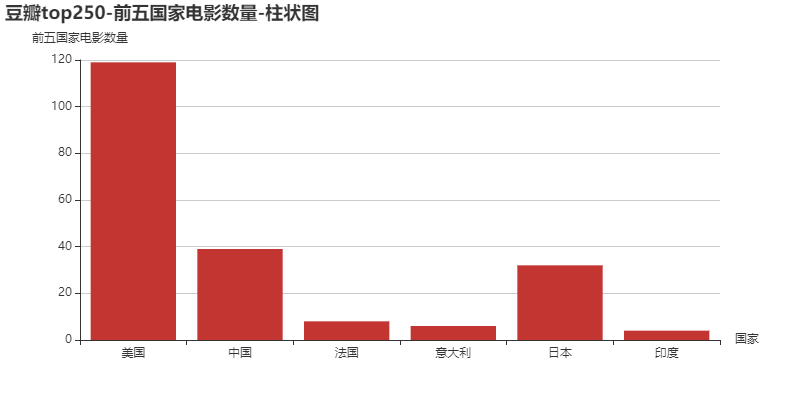
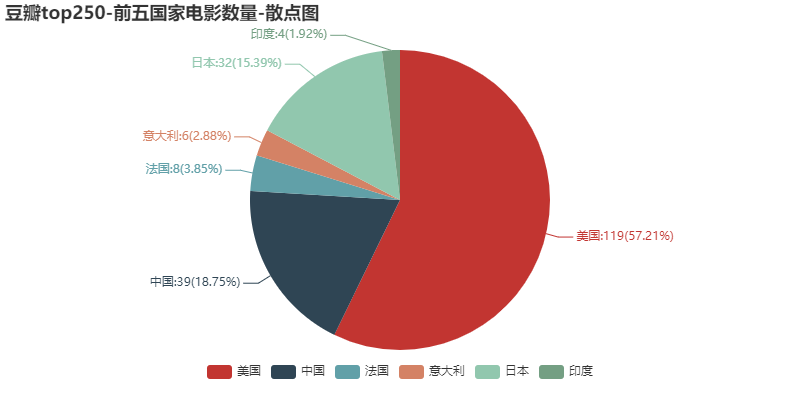
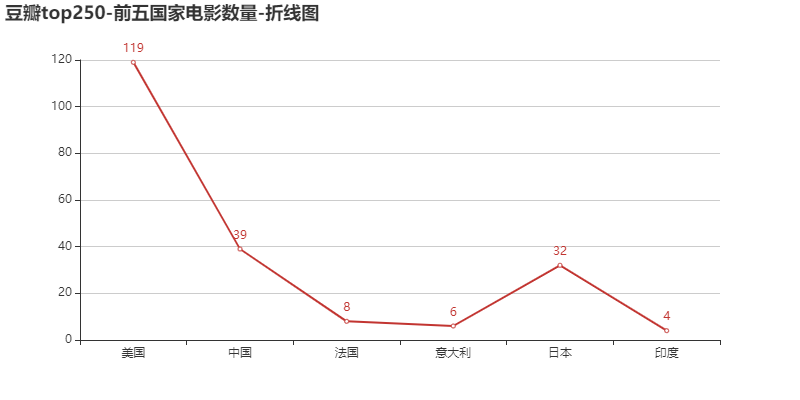
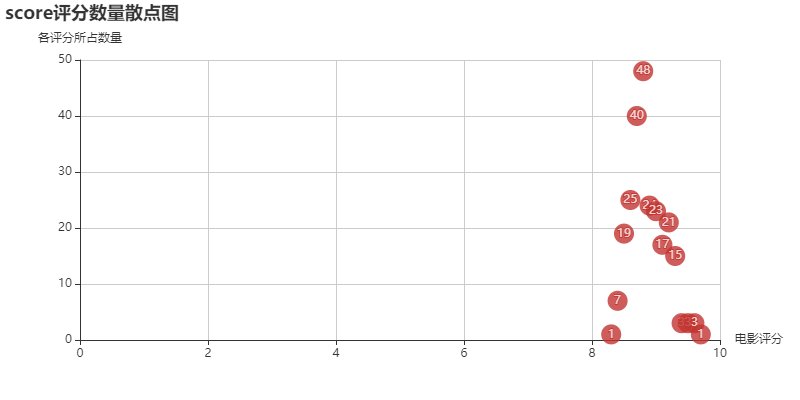
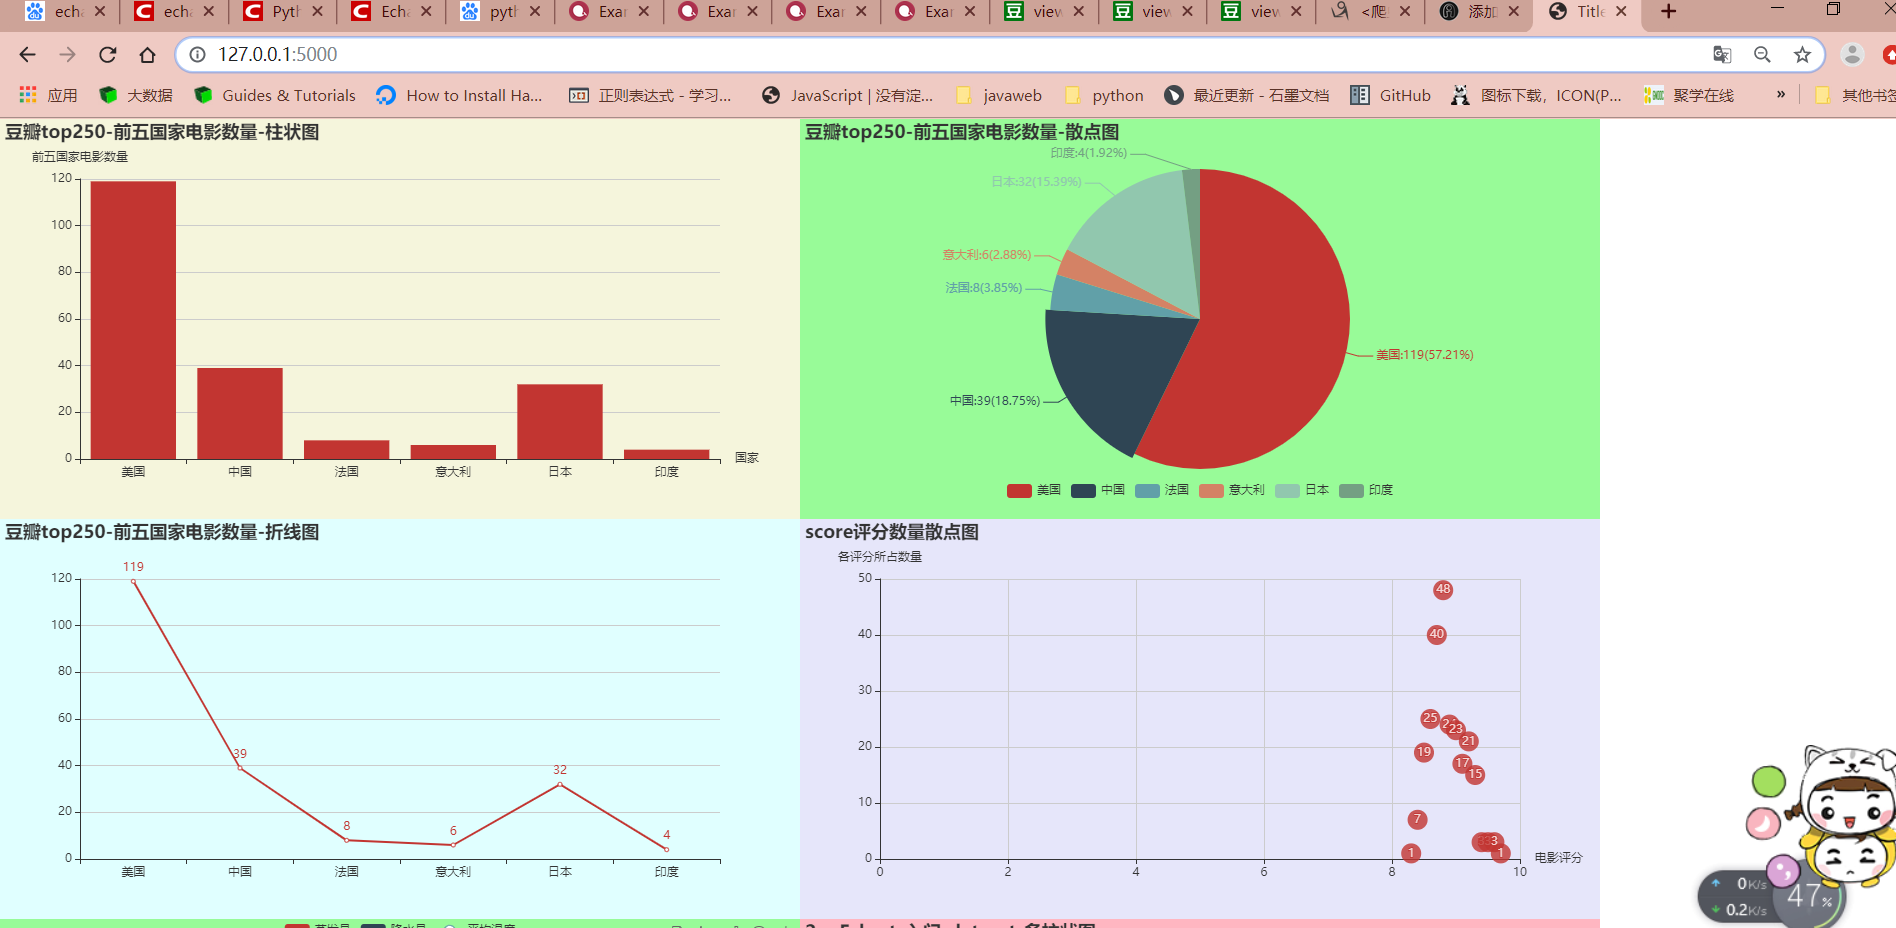
js 代码
    var option1 = {
        tooltip: {},
        legend : {
            data: ['销量']
        },
        xAxis:{
            data: {{ country }},
        },
        yAxis: {
        },
        series: [{
            name:'销量',
            type:'bar',
            data: {{ count }}
        }]
    };
    var myChart = echarts.init( document.getElementById('main1') );
    myChart.setOption(option1);
    option2 = {
        aria: {
            show: true
        },
        legend :{
            top:360,
        },
        series: [
            {
                name: '访问来源',
                type: 'pie',
                data: [
                    {% for con in pie  %}
                        { value: {{ con[1] }},name: '{{ con[0] }}' },
                    {% endfor %}
                ],
                label:{
                   normal:{
                       show:true,
                       formatter:'{b}:{c}({d}%)'
                   }
                }

            }
        ]
    };
    var myChart2 = echarts.init( document.getElementById('main2') );
    myChart2.setOption(option2);
    option3 = {
    xAxis: {
        type: 'category',
        data: {{ country|safe }}
    },
    yAxis: {
        type: 'value'
    },
    series: [{
        data: {{ count }},
        type: 'line',
    }]
};
    var myChart3 = echarts.init( document.getElementById('main3') );
    myChart3.setOption(option3);
    option4 = {
       title: {
          text: 'score评分数量散点图'
      },
        xAxis: {
            name: "电影评分",
        },
        yAxis: {
           name: "各评分所占数量",
        },
        series: [{
            symbolSize: 20,
            data: [
                {% for con in score %}
                [{{ con[0] }},{{ con[1] }}],
                {% endfor %}
            ],
            type: 'scatter',
            itemStyle: {  // 显示数值
                normal: {label : {show: true}}
            },
        }]
    };
    var myChart4 = echarts.init( document.getElementById('main4') );
    myChart4.setOption(option4);
数据
